Entity Framework Spatial Part 2: Querying data
Yesterday, we published a blog post on how to load geographic shapefile data into SQL Server using Entity Framework. Today, we'll show how to query and display this data on a map.

Querying geographic data
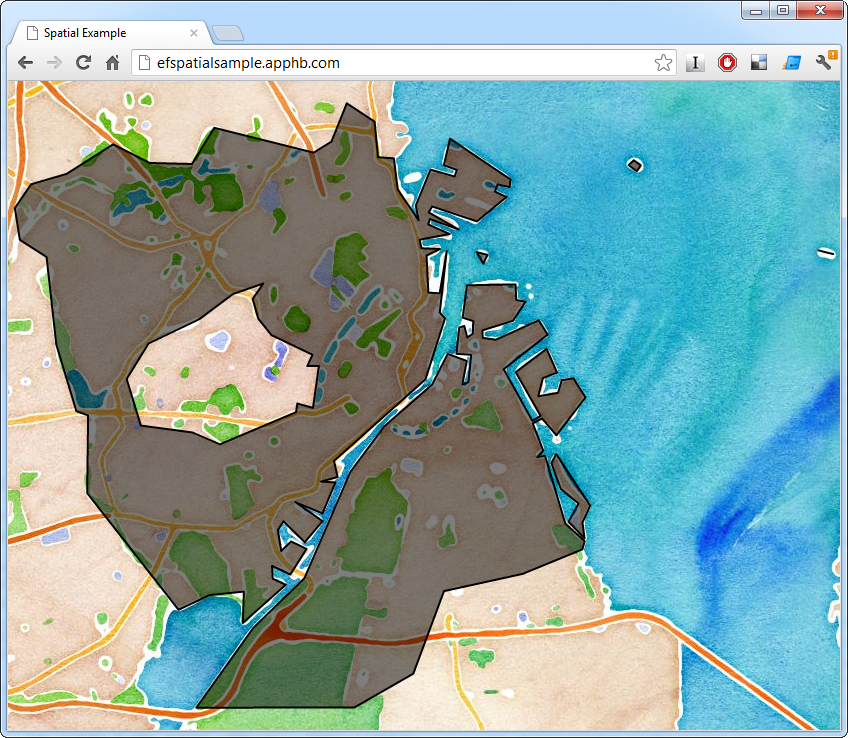
Remember that the objective was to let the user click anywhere on a browser map and be shown the bondary of the Danish municipality he clicked on. The ASP.NET MVC controller action to get accomplish this looks like so:
public ActionResult Show(double latitude, double longitude)
{
    var point = DbGeography.FromText(string.Format("POINT ({0} {1})", longitude, latitude),
        4326);
    var district = _context.Features
        .Where(x => x.Geography.Intersects(point))
        .Select(x => new { Name = x.Name, Geography = SqlSpatialFunctions.Reduce(
            x.Geography, 100).AsText() })
        .SingleOrDefault();

    if (district != null)
    {
        return Json(new
        {
            name = district.Name,
            geography = district.Geography,
        }, JsonRequestBehavior.AllowGet);
    }

    Response.StatusCode = 404;
    Response.TrySkipIisCustomErrors = true;
    return Json(new { }, JsonRequestBehavior.AllowGet);
}
The beauty of using Entity Framework is that we can use this line to find features that intersect the point that the user clicked on:
.Where(x => x.Geography.Intersects(point))
Entity Framework and SQL Server have some other tricks up their sleeves. One is SqlSpatialFunctions.Reduce() which lets us reduce the number of vertices in a polygon. This turns out to be important when the underlying spatial data is very detailed but needs to betransmitted to users quickly. The polygon of a municipality, using the most accurate data from the Danish mapping authority, may take up as much as 2 MB. The Reduce function lets us trade accuracy for reduced size so that shapes can be sent to a users' browser quickly.
The last trick is the AsText() method which converts the shape to Well-known text. We can pass this to OpenLayers to draw.
Rendering geographic data
For the web frontend for our geo data, we will use OpenLayers. Openlayers is a convenient abstraction of the various web-map libraries.
Adding OpenLayers and using this HTML and CSS will get us a nice full-screen map. HTML:
<div id="map"></div>

<script src="/assets/js/openlayers/OpenLayers.js"></script>
<script src="/assets/js/jquery-1.8.1.min.js"></script>
<script type="text/javascript" src="http://maps.stamen.com/js/tile.stamen.js?v1.1.3"></script>
<script src="/assets/js/map.js"></script>
CSS:
html, body, #map {
    margin: 0;
    width: 100%;
    height: 100%;
}
The map setup in map.js is straightforward. The vector layer is where municipality shapes are drawn:
$().ready(function () {
    var map = new OpenLayers.Map({
        div: "map",
        displayProjection: "EPSG:4326",
        layers: [
            new OpenLayers.Layer.Stamen("watercolor")
        ]
    });

    var bounds = new OpenLayers.Bounds([7.81, 54.52, 12.82, 57.87]);
    map.zoomToExtent(bounds.transform(map.displayProjection, map.getProjectionObject()));

    var vector = new OpenLayers.Layer.Vector("Vector Layer", {
        projection: map.displayProjection,
        styleMap: new OpenLayers.StyleMap({'default':{
            fillColor: '#000000',
            fillOpacity: 0.5,
            label: '${name}'
        }})
    });

    map.addLayer(vector);
});
The click handler looks like this:
map.events.register("click", map, function (event) {
    var lonLat = map.getLonLatFromPixel(event.xy)
        .transform(map.getProjectionObject(), map.displayProjection);
    $.ajax({
        url: '/feature/show',
        data: {
            latitude: lonLat.lat,
            longitude: lonLat.lon
        }
    }).done(function (result) {
        var reader = new OpenLayers.Format.WKT({
            'internalProjection': map.getProjectionObject(),
            'externalProjection': map.displayProjection
        });

        var feature = reader.read(result.geography);
        feature.attributes = {
            name: result.name
        };

        vector.removeAllFeatures();
        vector.addFeatures(feature);

        map.zoomToExtent(vector.getDataExtent());
    });
});
Note that we have to make sure that coordinates passed to the server are in WGS 84 (here referred to as EPSG:4326). When we get shapes from the server, the WKT reader also transforms hte coordinates into to projection used by the map.
We use the whimsical Stamen Watercolor tile-layer for fun.
Some more setup
In addition to the setup detailed in the previous post, we'll want to add additional automation of data load and deployment environment setup. To automatically load spatial data if it's not already in the database, we'll override the Seed() method in the Entity Framework Configuration:
protected override void Seed(Context context)
{
    if (!context.Features.Any())
    {
        var assemblyDirectory =
            Path.GetDirectoryName(new Uri(Assembly.GetExecutingAssembly().CodeBase).LocalPath);
        var seedDataFilePath =
            Directory.GetFiles(assemblyDirectory, "KOMMUNE.*", SearchOption.AllDirectories).First();
        var seedDataDirectory = Path.GetDirectoryName(seedDataFilePath);

        var shapes = new DagiShapeFileReader()
            .Read(Path.Combine(seedDataDirectory, "KOMMUNE"), "KOMNAVN");

        foreach (var shape in shapes)
        {
            context.Features.Add(new Feature { Name = shape.Key, Geography = shape.Value });
        }
        context.SaveChanges();
    }

    base.Seed(context);
}
The shape files are included as content in the project that holds the entity framework setup to ensure it's available at runtime.
The last piece of housekeeping that we need to do is to make sure that the spatial assemblies (Microsoft.SqlServer.Types.dll and SqlServerSpatial110.dll) are available at runtime. The rationale behind this is descriped in this blog post, and the newest version of the dll's can be had here – you want SQLSysClrTypes.msi. In case they are not installed on the server running the app, we simply bin-deploy them using this post-build event (this assumes you're storing them in a folder called lib\Microsoft.SqlServer.Types):
copy "$(SolutionDir)lib\Microsoft.SqlServer.Types\*" "$(WebProjectOutputDir)\$(OutputPath)"
Wrap up
That's it for part 2 of this guide. You can try out the app running on AppHarbor and take a look at the full source code on GitHub. We expect to expand on the sample as we build our Entity Framework Spatial knowledge.
