Introducing Trace Logging
Today we’re happy to introduce trace message integration with your application log. With tracing you can very easily log trace messages to your application's log stream by using the built-in tracing capabilities of the .NET framework from anywhere in your application.
When introducing the realtime logging module a while back we opened up access to collated log data from load balancers, the build and deploy infrastructure, background workers and more. Notably missing however was the ability to log from web workers. We’re closing that gap with tracing, which can be used in both background and web workers.
How to use it
The trace feature integrates with standard .NET tracing, so you don’t have to make any changes to your application to use it. You can simply log traces from your workers with the System.Diagnostics.Trace class:
Trace.TraceInformation("Hello world");
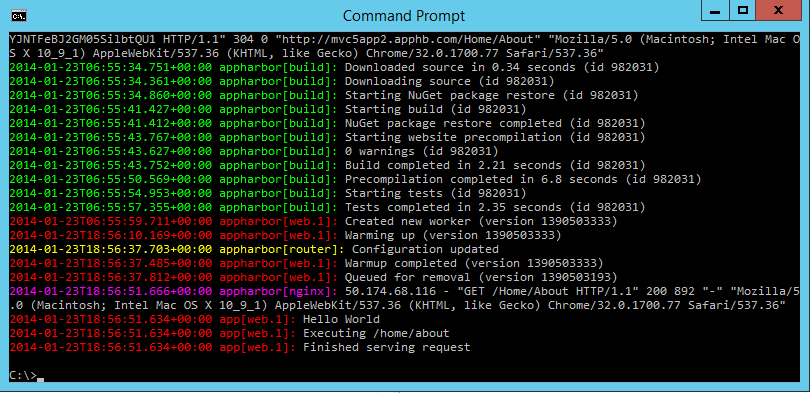
This will yield a log message containing a timestamp and the source of the trace in your application’s log like so:
2014-01-22T06:46:48.086+00:00 app web.1 Hello World
You can also use a TraceSource by specifying the trace source name AppHarborTraceSource:
var traceSource = new TraceSource("AppHarborTraceSource", defaultLevel: SourceLevels.All);
traceSource.TraceEvent(TraceEventType.Critical, 0, "Foo");
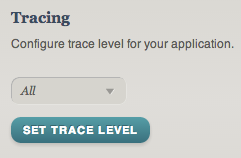
You may not always want noisy trace messages in your logs and you can configure the trace level on the "Logging" page. There are 4 levels: All, Warning, Error and None. Setting the trace level will update the configuration without redeploying or restarting the application. This is often desirable if you need to turn on tracing when debugging and diagnosing an ongoing or state-related issue.

There are a number of other ways to use the new tracing feature including:
- ASP.NET health monitoring (for logging exceptions, application lifecycle events etc).
- A logging library such as NLog (
Tracetarget) or log4net (TraceAppender). - Integrating with ETW (Event Tracing for Windows) directly using the injected event provider id.
Anything that integrates with .NET tracing or ETW should work, and you can find more details and examples in this knowledge base article.
All new applications have tracing enabled by default. Tracing can be enabled for existing applications on the "Logging" page.
How does it work
Under the hood we’re using ETW for delivering log messages to the components that are responsible for sending traces to your log stream. Application performance is unaffected by the delivery of log messages as this takes place completely out of process. Note however that messages are buffered for about a second and that some messages may be dropped if you’re writing excessively to the trace output.
When tracing is enabled, AppHarbor configures your application with an EventProviderTraceListener as a default trace listener. While you can integrate directly with ETW as well we recommend using the Trace or TraceSource approaches described above.
Viewing trace messages
Traces are collated with other logging sources in your log stream, so you can consume them in the same way you’re used to. You can view log messages using the command line interface, the web viewer or set up a log drain to any HTTP, HTTPS or syslog endpoint. For more information about the various integration points please refer to this article.

We’ve got a couple of cool features that builds on this ready soon, so stay tuned and happy tracing!
