Librato integration and built-in perfomance metrics

Being able to monitor and analyze key application metrics is an essential part of developing stable, performant and high quality web services that meets you business requirements. Today we’re announcing a great new set of features to provide a turnkey solution for visualizing, analyzing and acting on key performance metrics. On top of that we’re enabling you to easily track your own operational metrics. In this blog post we’ll look at how the pieces tie together.
Librato integration
The best part of today’s release is our new integration with Librato for monitoring and analyzing metrics. Librato is an awesome and incredibly useful service that enables you to easily visualize and correlate metrics, including the new log-based performance metrics provided by AppHarbor (described in more details below).
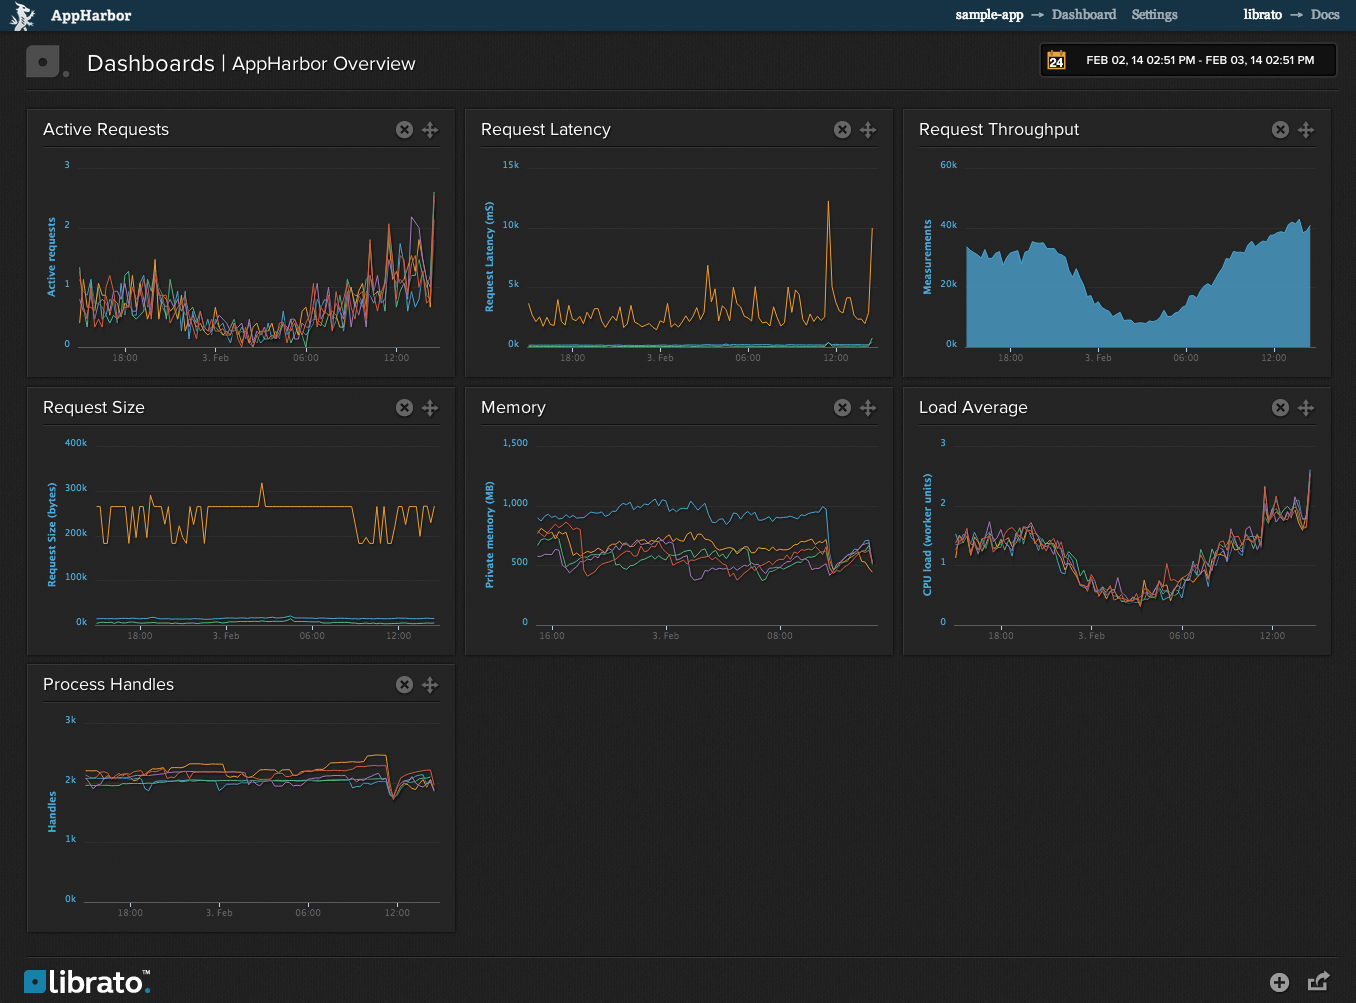
Librato is now available as an add-on and integrates seamlessly with your AppHarbor logs. When you provision the add-on, Librato will setup a preconfigured dashboard tailored for displaying AppHarbor performance data and you can access it immediately by going to the Librato admin page. Everything will work out of the box without any further configuration and your logs will automatically be sent to Librato using a log drain.
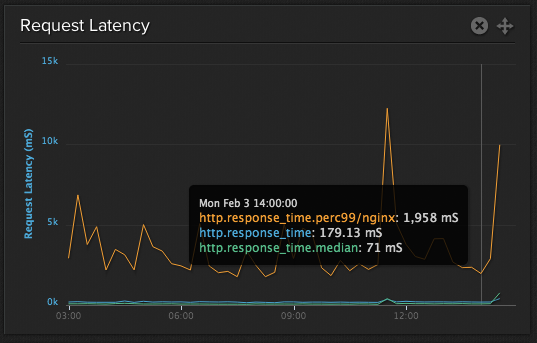
When log messages containing metric data are sent to Librato they’re transformed by an l2met service before being sent to their regular API. A very cool feature of the l2met service is that it can automatically calculate some useful metrics. For instance, it’ll calculate the median response time as well as the the 99th and 95th percentile of measurements such as response times. The perc99 response time means the response time of the 99% fastest responses. It can be useful to know this value since it's less affected by a few very slow responses than the average. Among other things this provides a good measurement of the browsing experience for most of your users.

The l2met project was started by Ryan Smith - a big shout-out and thanks to him and the Librato team for developing this great tool.
For more information about how to integrate with Librato and details about the service please refer to the documentation here. Also check out their announcement blog post about the integration.
Built-in performance metrics
AppHarbor can now write key runtime performance metrics directly to your application’s log stream as l2met 2.0 formatted messages similar to this:
source=web.5 sample#memory.private_bytes=701091840
source=web.5 sample#process.handles=2597
source=web.5 sample#cpu.load_average=1.97
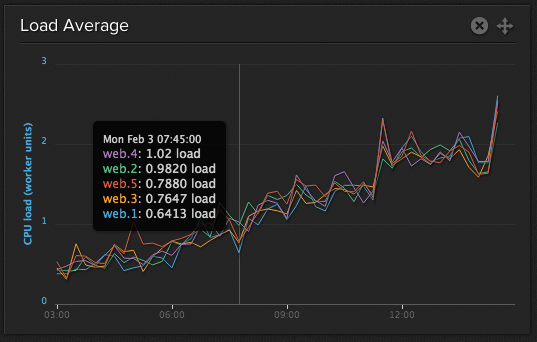
These are the messages Librato uses as well and most of them are written every 20 seconds. They allow for real-time monitoring of worker-specific runtime metrics such as CPU (load average) and memory usage, as well as measurements of response time and size reported from the load balancers. Because these metrics are logged to your log stream you can also consume them in the same way you’d usually view or integrate with your logs.

Performance data collection takes place completely out-of-process, without using a profiler, and it can be enabled and disabled without redeploying the application. This means that monitoring won’t impact application performance at all and that a profiler (such as New Relic) can still be attached to the application.
Writing custom metrics
The performance data provided by AppHarbor is probably not the only metrics you want to track. You can of course integrate directly with Librato’s API, but the l2met integration makes it easier than ever to track your own metrics, and the paid Librato plans includes the ability to track custom metrics exactly for that purpose.
You can start writing your own metrics simply by sending an l2met-formatted string to your logs. Last week we introduced the Trace Logging feature which is perfect for this, so writing your custom metrics can now be done with a simple trace:
Trace.TraceInformation(“measure#twitter.lookup.time=433”);
To make this even easier we’ve built the metric-reporter library (a .NET port of Librato’s log-reporter) to provide an easy to use interface for writing metrics to your log stream. You can install it with NuGet:
Install-Package MetricReporter
Then initialize a MetricReporter which writes to a text writer:
var writer = new L2MetWriter(new TraceTextWriter);
var reporter = new MetricReporter(metricWriter);
And start tracking your own custom metrics:
reporter.Increment("jobs.completed");
reporter.Measure("payload.size", 21276);
reporter.Measure("twitter.lookup.time", () =>
{
    //Do work
    twitterRequest.GetResponse();
});
On Librato you can then view charts with these new metrics along with the performance metrics provided by AppHarbor, and add them to your dashboards, aggregate and correlate data, set up alerts etc. The MetricReporter library will take care of writing l2met-formatted metrics using the appropriate metric types and write to the trace or another IO stream. Make sure to inspect the README for more examples and information on configuration and usage.
That’s all we have for today. There’ll be more examples on how you can use these new features soon, but for now we encourage you to take it for a spin, install the Librato add-on and test the waters for yourself. We’d love to hear what you think so if there are other metrics you’d like to see or if you experience any issues please hit us up through the usual channels.

